Debugging SharePoint Commands – Extending Visual Studio SharePoint development tools tip #8
One of the cool things about the new Visual Studio SharePoint development tools is the ability to communicate with SharePoint to retrieve and work with SharePoint content. Running SharePoint code in the context of a Visual Studio SharePoint development tools extension is pretty simple, but you do have to know one thing in order to be able to debug it.
While running SharePoint code doesn’t sound that exciting at first, the team responsible for the Visual Studio SharePoint development tools has done some great job making this possible. Visual Studio 2010 is still a 32-bit process while SharePoint 2010 itself is a 64-bit process. Additionally the new SharePoint development tools have been built using the .NET 4.0 framework while all of the SharePoint 2010 code runs using the .NET 3.5 framework. All that made it extra challenging to the Visual Studio team to get it working. As a result we have a highly extensible and flexible set of tools that we can tailor to our specific needs. The process of extending the Visual Studio SharePoint development tools is pretty straightforward and has been explained on MSDN. The only thing you have to keep in mind is how to debug SharePoint Commands used by the tools.
Debugging 101
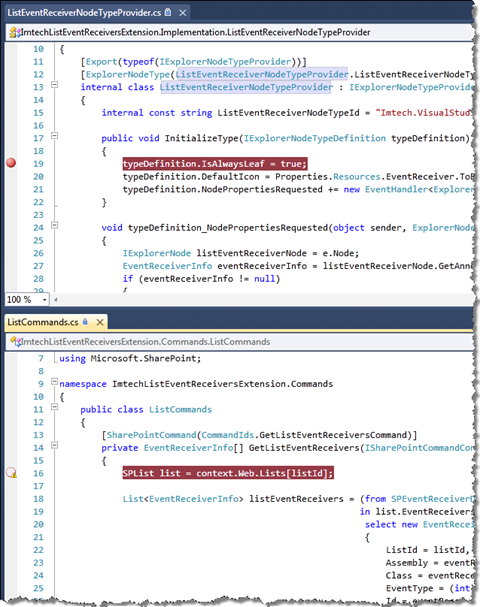
Debugging custom extensions for the new Visual Studio SharePoint development tools is very simple. If you have followed the guidelines for creating extensions on MSDN all you need to do is to set a breakpoint and hit F5. Visual Studio 2010 will take care of the rest for you automatically starting a new instance of Visual Studio and attaching the debugger. However this will only work for the default implementation code. If you’re making use of SharePoint Commands in your extension the symbols for that assembly will not get loaded and the breakpoint will not get hit:
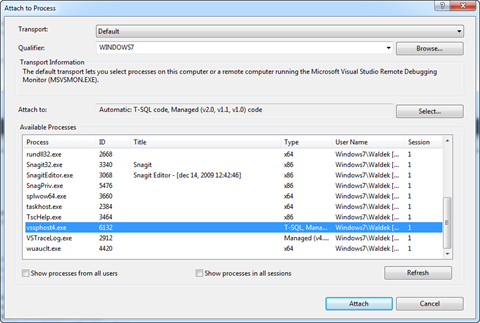
This situation has to do with the fact that the SharePoint Commands code will get executed not by the 32-bit devenv.exe process (Visual Studio 2010 instance) but by the vssphost4.exe process. So in order to debug the SharePoint Commands code, you have to manually attach the debugger to the vssphost4.exe process:
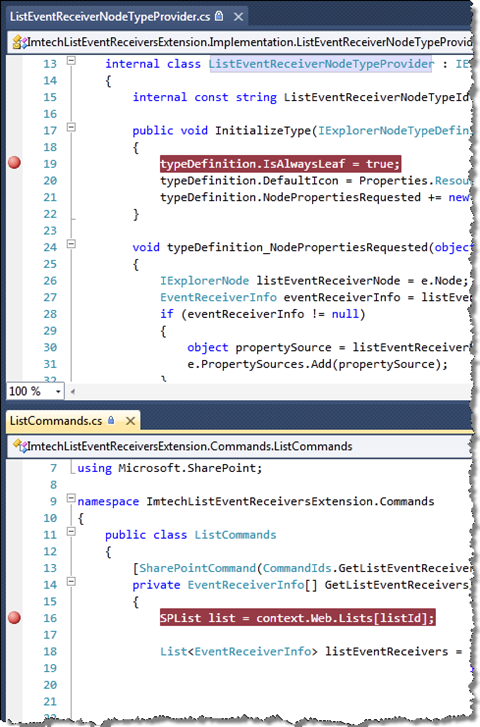
Attaching the debugger to the vssphost4.exe process should cause the symbols to be loaded and the breakpoint to be hit:
Yet one more thing to keep in mind…
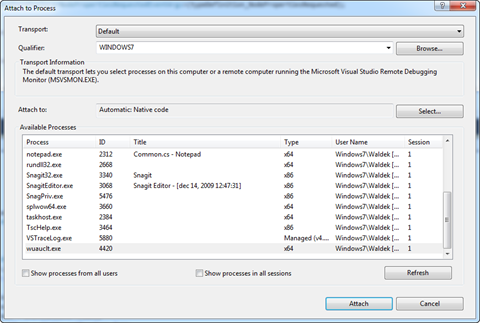
When you try to attach the debugger to the vssphost4.exe process too early it won’t be available on the list of running processes:
The vssphost4.exe process is being started after the extensions have been loaded meaning after you opened at least on SharePoint connection node in the SharePoint Explorer.
Technorati Tags: SharePoint 2010,Visual Studio 2010


