Did you know: using Developer Dashboard for monitoring performance of your solutions
SharePoint 2010 ships with Developer Dashboard which allows you to see how well different pieces of SharePoint are performing. And while it’s extremely useful by itself, it becomes even more important when used to measure the performance of your custom code!
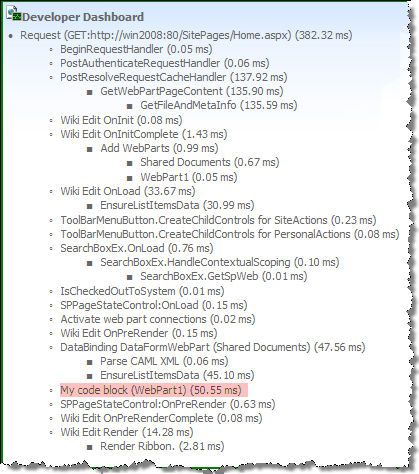
Logging the performance of your custom code to Developer Dashboard is really easy. All you have to do is to wrap a block of your code in a using clause and that’s it:
protected override void CreateChildControls()
{
    using (new SPMonitoredScope("My code block (WebPart1)"))
    {
        Thread.Sleep(50);
    }
}
Will log the following message to the Developer Dashboard:
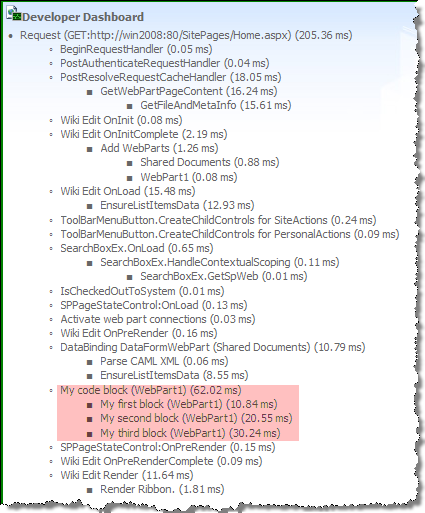
That’s not all. You can also nest messages to provide some more granular information about your code. All you have to do is to nest the using statements and the Developer Dashboard will do the rest for you:
protected override void CreateChildControls()
{
    using (new SPMonitoredScope("My code block (WebPart1)"))
    {
        using (new SPMonitoredScope("My first block (WebPart1)"))
        {
            Thread.Sleep(10);
        }

        using (new SPMonitoredScope("My second block (WebPart1)"))
        {
            Thread.Sleep(20);
        }

        using (new SPMonitoredScope("My third block (WebPart1)"))
        {
            Thread.Sleep(30);
        }
    }
}
Notice the nested overview in the Developer Dashboard:
One thing to remember about the Developer Dashboard is that you cannot log the performance of your code from Sandbox Solutions. The SPMonitoredScope class responsible for measuring the performance of your code and logging it to the Developer Dashboard doesn’t belong to the types supported in the Sandbox at this moment.
Technorati Tags: SharePoint 2010

