Easily debug production version of your SharePoint Framework solution
When your SharePoint Framework solution doesn’t work as expected in production, the ability to debug it right there, in the production tenant, will save you a lot of time.
Optimize for production
When building SharePoint Framework solutions, the toolchain allows you to build the solution in the debug or release (also known as ship) mode.
The debug mode
Solution built in the debug mode contains unoptimized versions of scripts. While the SharePoint Framework toolchain combines all files into a single bundle, the bundle contents are still quite readable by a human being.
The name says it all: debug. The debug version of your solution is meant for debugging. It’s not optimized, but it doesn’t have to be. It’s intended to be running only on your local machine.
When building solutions on the SharePoint Framework, by default you use TypeScript. When building your project, the toolchain will transpile your TypeScript code to JavaScript which will be executed in the browser. But if the code doesn’t work as expected, ideally, you would want to be able to set the breakpoint in the code you originally wrote - TypeScript, rather than the generated JavaScript. And you can! A part of the debug build is the source map, which maps the generated JavaScript code to the original TypeScript code you wrote. So while the browser executes the generated JavaScript, using the information from the source map, which it loaded from the debug build, it allows you to set a breakpoint and step through the original TypeScript code.
The release mode
When you build your solution in the release mode, the main purpose is to optimize it for running in production. One part of the optimaztion is to remove everything that’s unnecessary. Additionally, the generated code is minified to minimize the amount of data that the browser needs to load. While the browser can process the code just fine, it’s hard for you to make any sense of it.
The ugly
Despite the best intentions and testing, sometimes things break in production. And when you try to debug a production version of your SharePoint Framework solution, you will have little luck. Even though the browser will help you prettify the source code, it will be difficult for you to make sense of it, not to mention to map it to your original code.
But did you know, that with a bit of planning ahead and a few modifications, you can debug your production code, just as if you did on your local dev machine?
Debug production build of a SharePoint Framework solution
Debugging the production version of your SharePoint Framework solution requires two steps: generating the source map for your optimized code, and loading the source map in the browser. If you ever debugged production versions of .NET code using PDBs, it’s very much alike.
Generate source map for release build
By default, the SharePoint Framework toolchain builds source maps only in debug mode. With a small change to the build process, you can have it build source maps for the production version of your solution too.
In the code editor, open the gulpfile.js file and change its contents to:
'use strict';

const gulp = require('gulp');
const build = require('@microsoft/sp-build-web');
const webpack = require('webpack');
build.addSuppression(`Warning - [sass] The local CSS class 'ms-Grid' is not camelCase and will not be type-safe.`);

build.configureWebpack.mergeConfig({
  additionalConfiguration: (generatedConfiguration) => {
    generatedConfiguration.devtool = 'source-map';

    for (var i = 0; i < generatedConfiguration.plugins.length; i++) {
      const plugin = generatedConfiguration.plugins[i];
      if (plugin instanceof webpack.optimize.UglifyJsPlugin) {
        plugin.options.sourceMap = true;
        break;
      }
    }

    return generatedConfiguration;
  }
});

build.initialize(gulp);
First, add the reference to webpack (line 5). Next, instruct webpack to build source maps (line 10). Because the code is minified using the UglifyJs webpack plugin, you also have to instruct the plugin to generate source maps. To do this, get the reference to the plugin from the current configuration and set the sourceMap option to true (lines 12-18).
The next time you build your project in release mode, The dist folder will contain not only the bundle and the manifest but also the the source map.
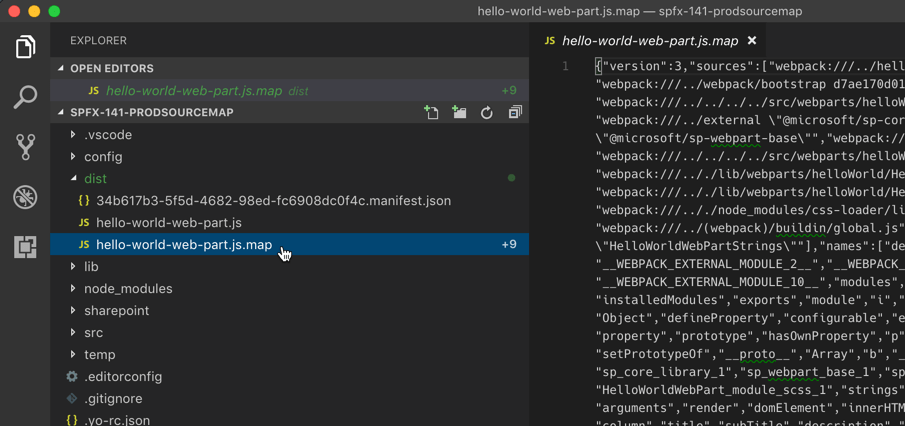
If you package your project in release mode, the SharePoint Framework toolchain won’t include the source map in the generated package. And that’s a good thing. The source map contains the original code which most likely you don’t want to share. But if you want to be able to debug your code in production, it’s important, that you store the generated source map somewhere.
Load the source map for your code running in production
When generating source maps for your production code, the SharePoint Framework toolchain included a reference to the source map at the end of the generated bundle file.
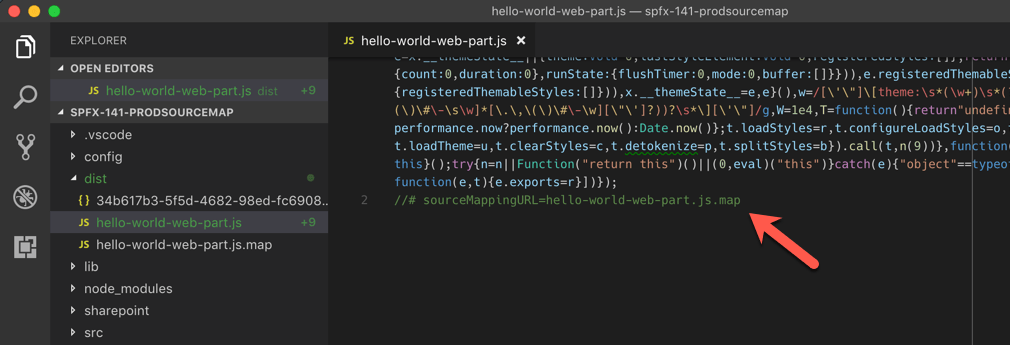
But because the source map wasn’t included in the package, that reference is useless. So how do you load the source map for your minified code?
What’s required to load a source map
The only requirement, to be able to load a source map for your code, is that the source map is hosted on a URL. It doesn’t matter if the URL is on the same domain as the web part or not. It doesn’t matter if it’s http or https. It doesn’t even matter if it’s localhost. As long as the browser can access the source map via the URL.
Serving local source map
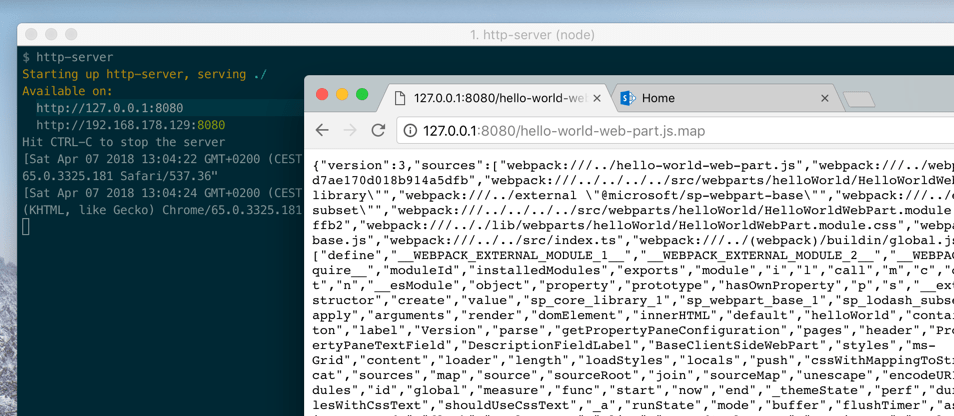
While you could have your source maps stored somewhere on a public URL, you are more likely to have it available on your developer machine. The easiest way I found to serve files from a local machine is by using the http-server. After installing it using npm by executing npm i -g http-server, change the working directory to where your source map is stored, and execute http-server. http-server will start a local web server with all the files from the directory available via a localhost URL.
Load the source map in the browser
While the following example is based on a SharePoint Framework client-side web part, you can use the same approach for debugging SharePoint Framework extensions.
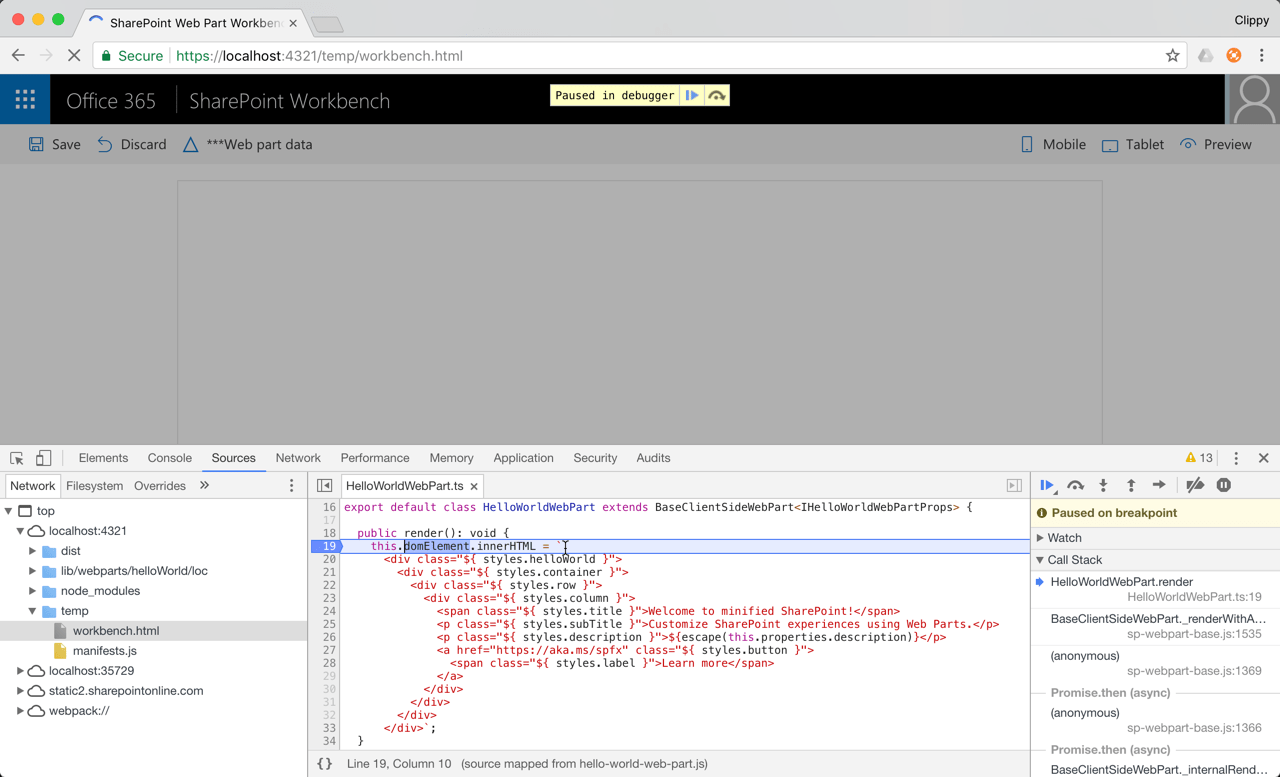
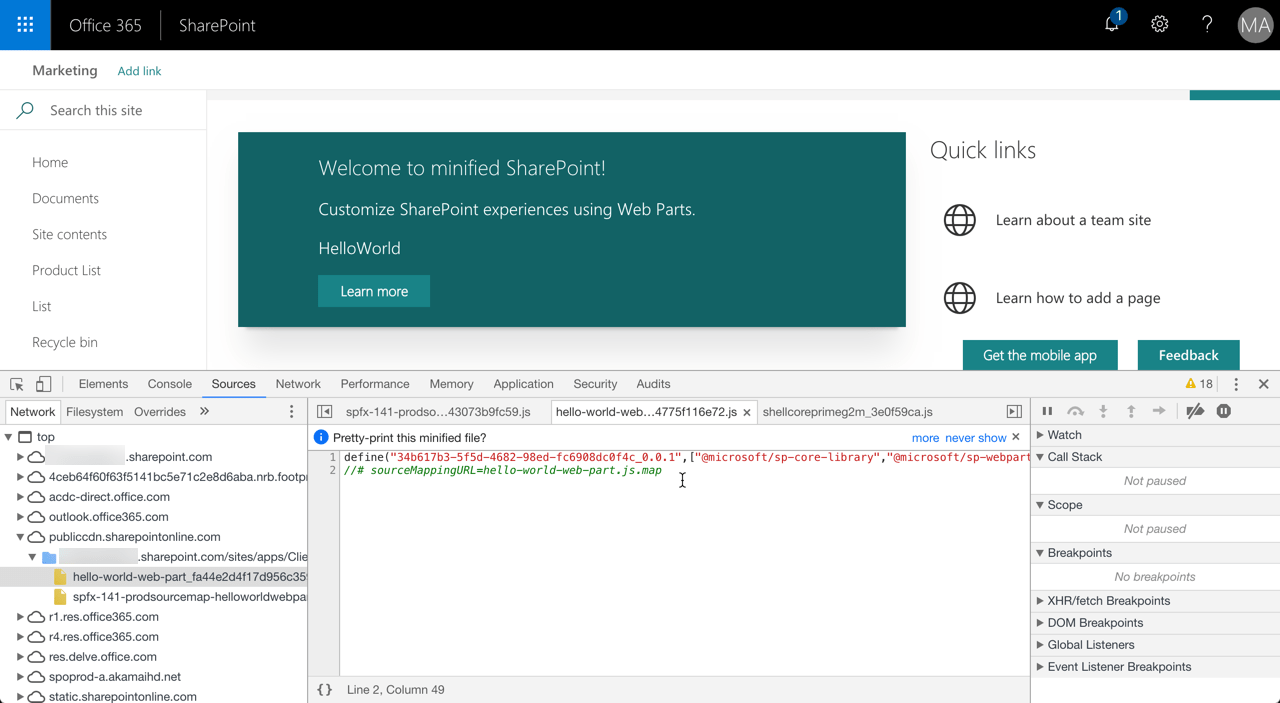
Now that the source is accessible via a URL, copy that URL to the clipboard. Next, navigate to the SharePoint page where the web part that you want to debug is located. Open the web browser’s developer tools, and in the list of loaded scripts, locate the bundle file where the web part is defined.
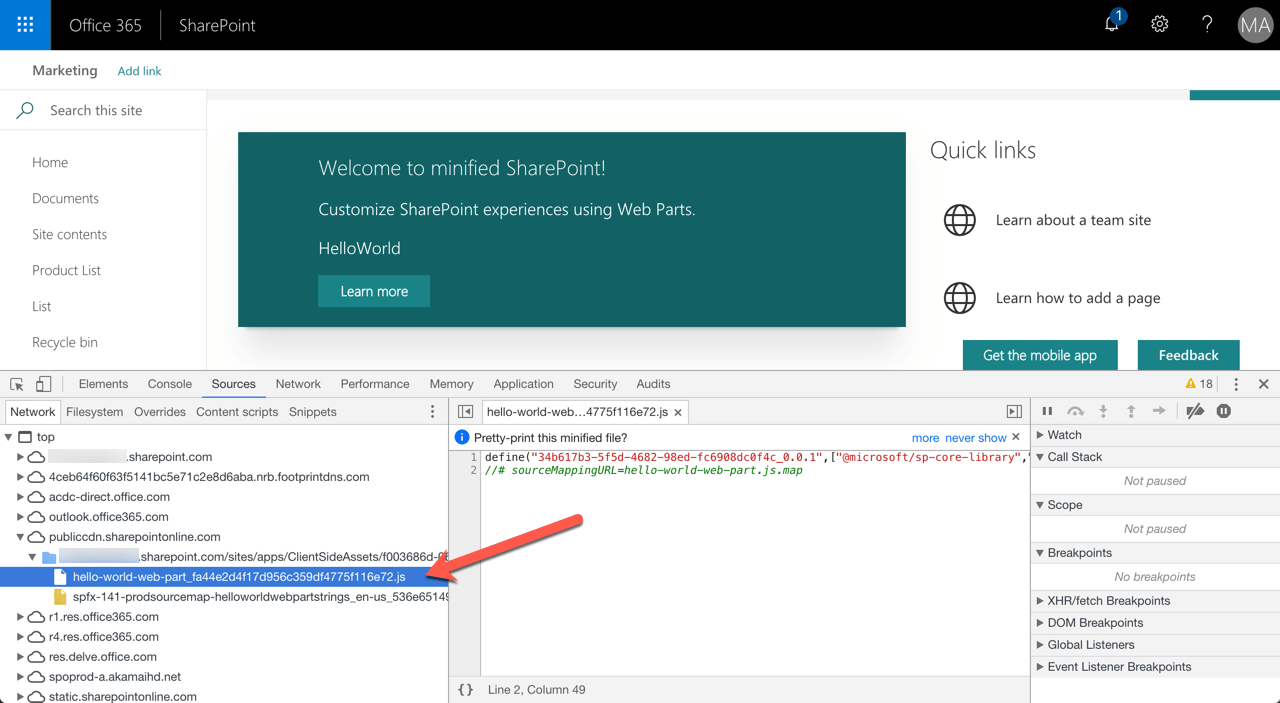
Next, just before the define keyword, place a breakpoint.
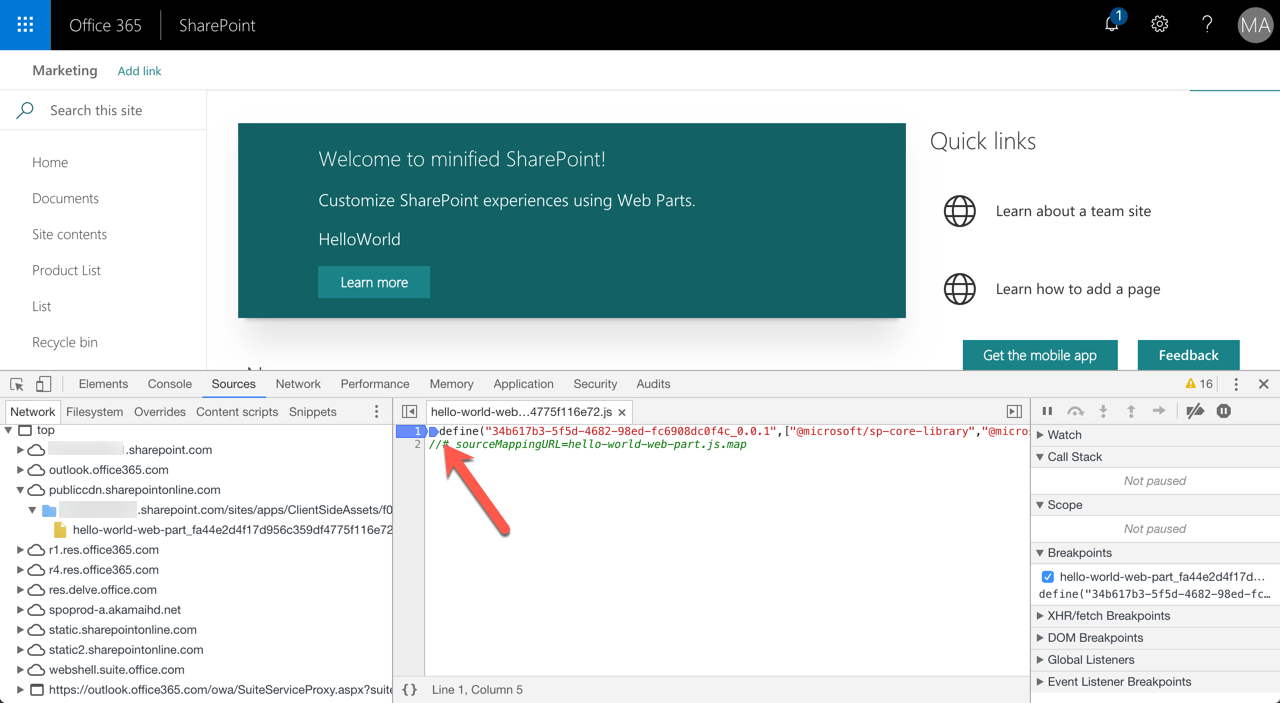
This is necessary, so that you can load the source map before the web part’s code is executed. This will allow you to debug its complete lifecycle.
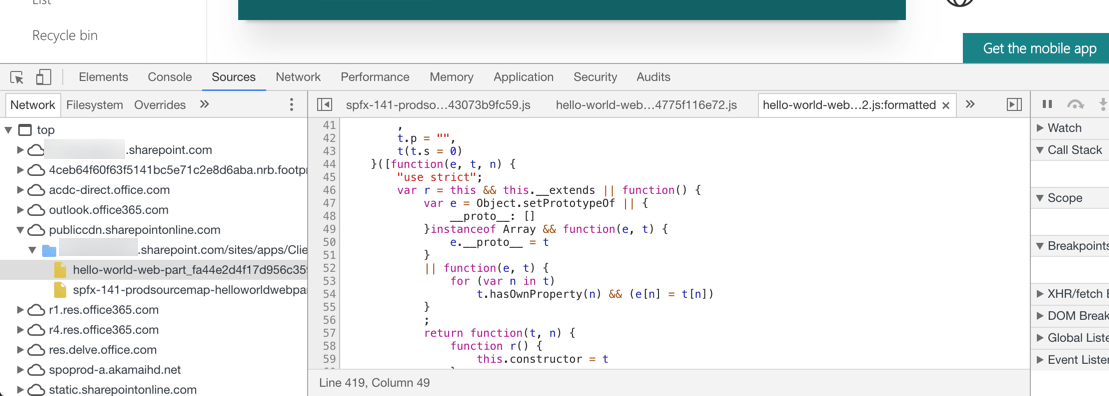
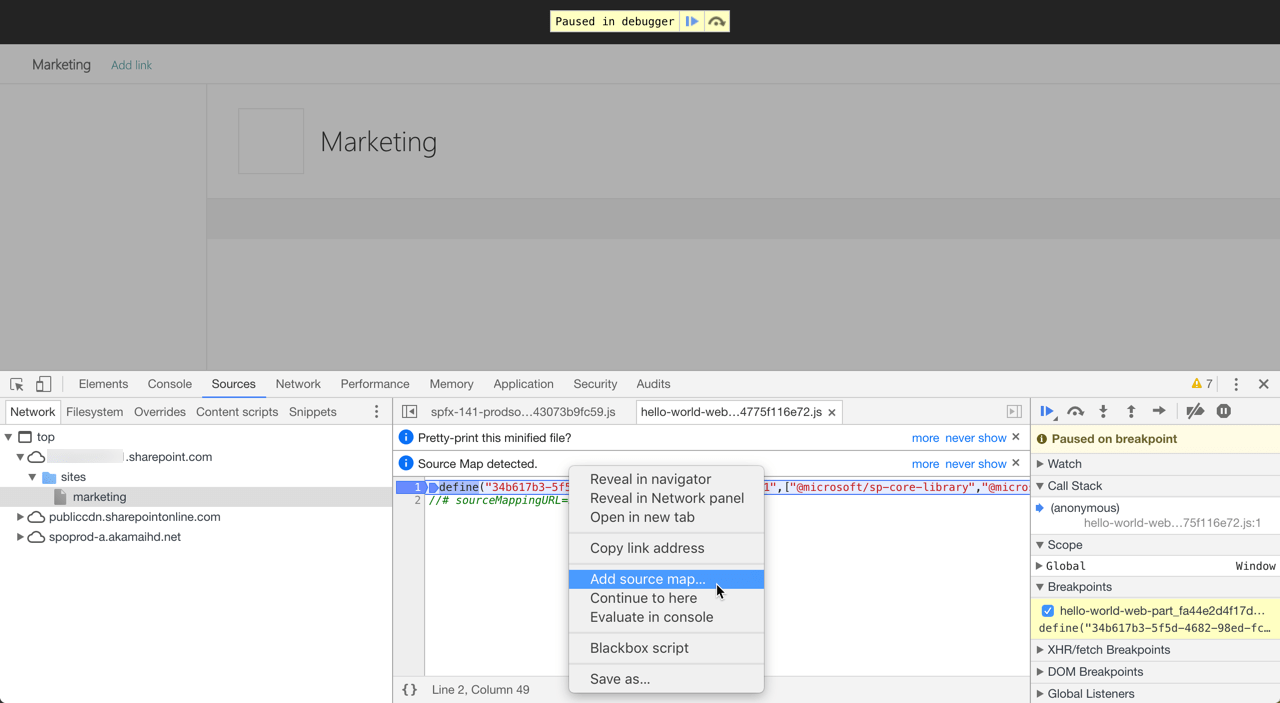
Next, reload the page. The developer tools will stop at the breakpoint you have just enabled. Then, in the same window where you set the breakpoint, click right, and from the context menu choose Add source map….
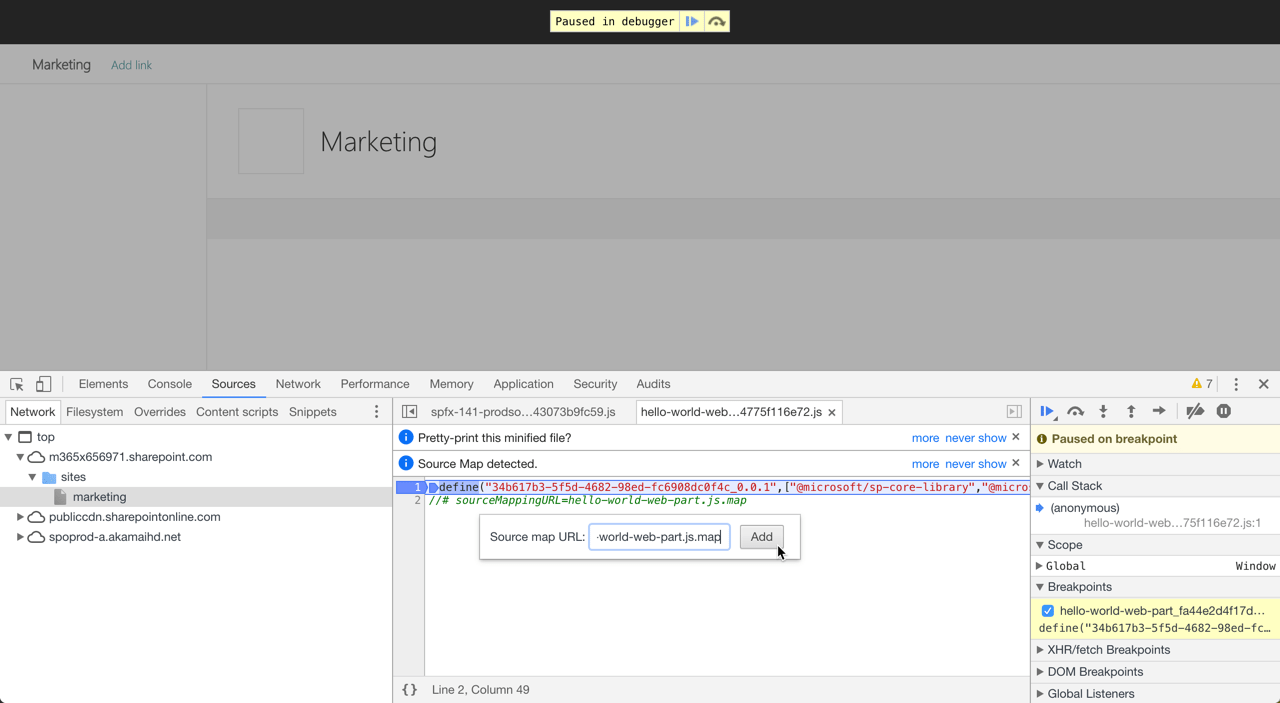
In the dialog window, paste the source map URL you copied previously, and click the Add button.
The browser will load the source map and on the Network tab, you will now see a new entry named webpack://. Navigate to webpack://../../ where you should see a folder named ../../src/webparts/helloWorld which contains the original TypeScript file you created.
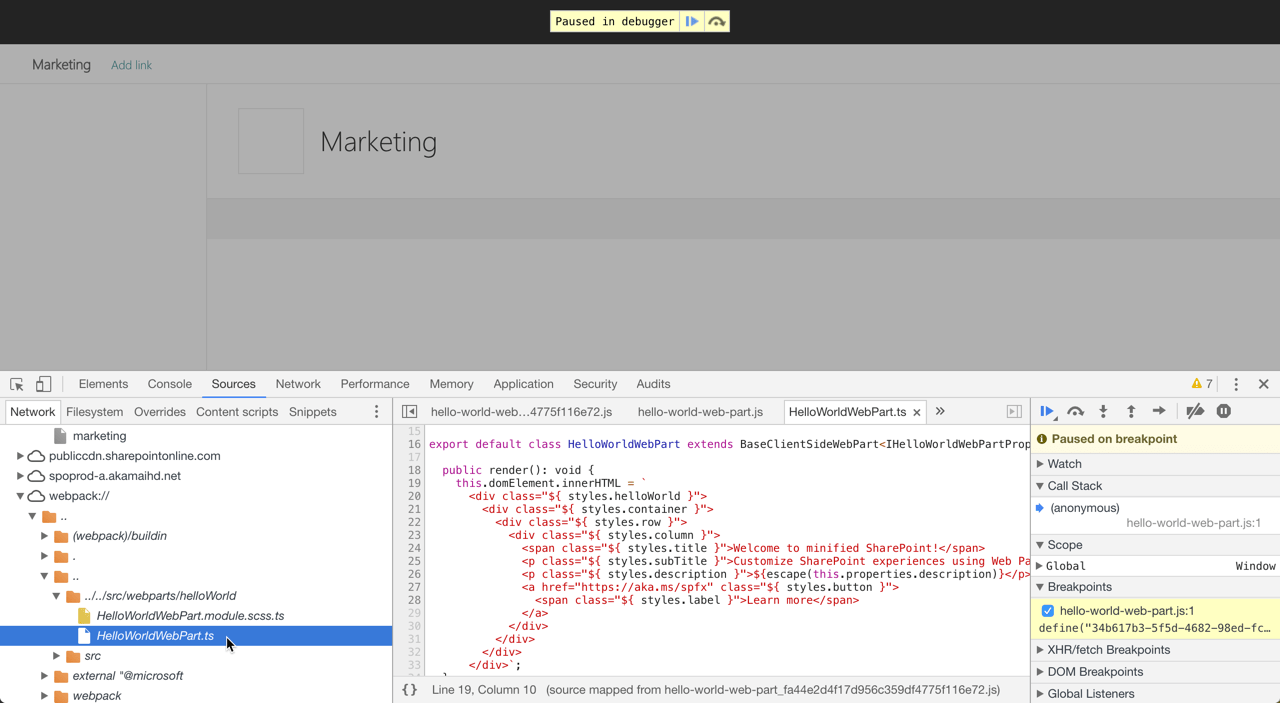
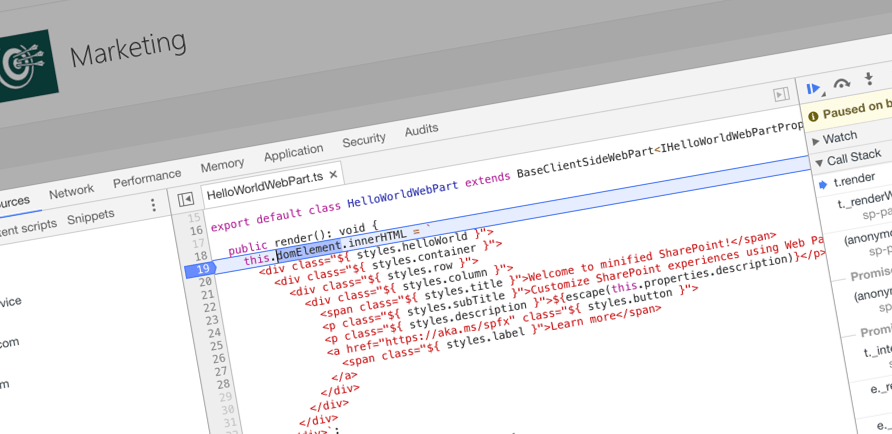
Atfer opening the TypeScript file, you will be able to put a breakpoint anywhere in your original TypeScript code!
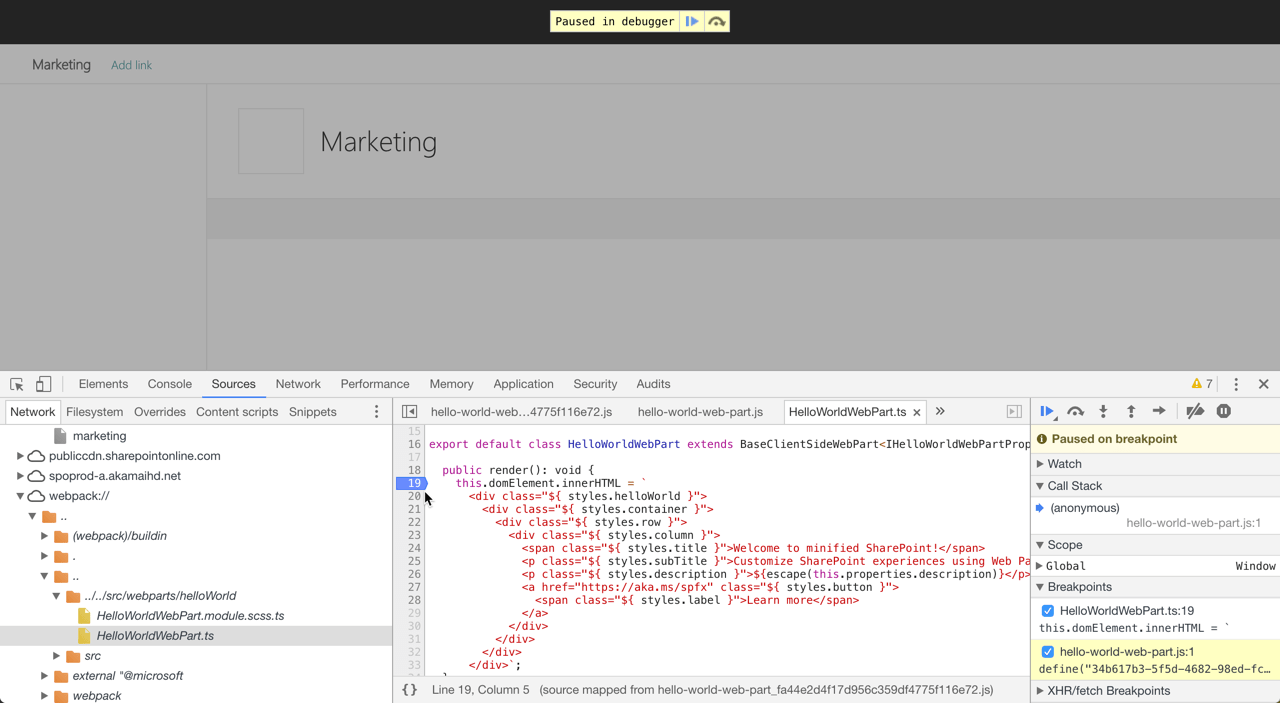
Once you resume loading the page, the browser will stop at the breakpoint you set, allowing you to step through the TypeScript code that you originally wrote. And all that while running in production!
Summary
When releasing your SharePoint Framework solution to production, you build it in release mode to optimize the generated bundle. In the optimization process, the information required to debug your code files is lost, making it hard for you to debug your solution should it be necessary. With a small change to the build process, you can keep the debug information while having the generated bundle still optimized for running in production. This makes it possible for you to debug your solutions directly in production using the exact configuration parameters which will make it easier for you to find out why your solution isn’t working as expected.