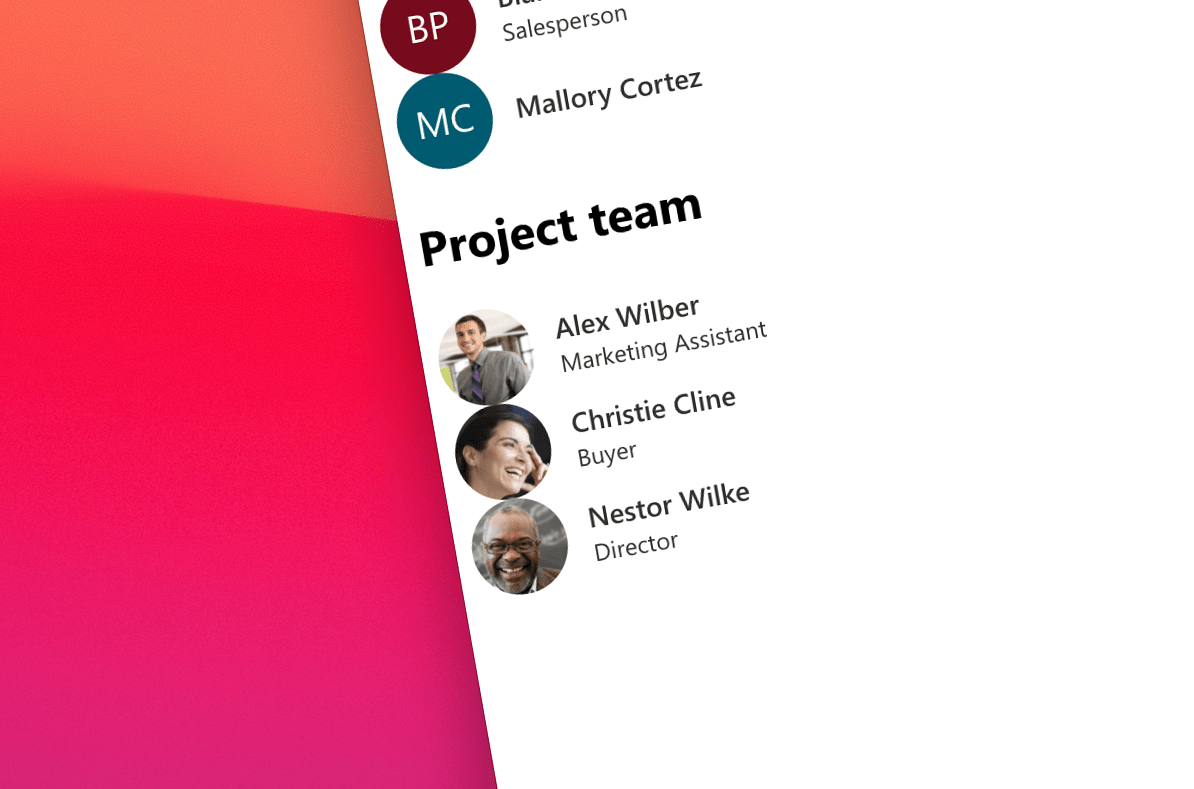
#52 Show line of business data with Microsoft Graph Toolkit
Often, when we build apps, we combine data from Microsoft 365 and line of business (LOB) systems. This gives us the best of both worlds: we can show users crucial work information enriched with organizational insights from Microsoft 365.
Using Microsoft Graph Toolkit is the easiest way to connect to Microsoft 365. With its providers and components, you’ll get to show data from Microsoft 365 in minutes. But what about the LOB? Typically, this is where you’re on your own. Since each system is different, it makes sense that you need a specialized UI for it, no?
Not quite. You see, you can use Microsoft Graph Toolkit to show Microsoft 365 data, but you can also use it to show any arbitrary data as well! Each component has a specific property to pass data to it and when you do, it will render it seamlessly along with data retrieved from Microsoft 365. Think about that: with Microsoft Graph Toolkit you can seamlessly integrate data from Microsoft 365 and line of business system without wasting hours on the UI!
If you’re intrigued about the idea, check out my latest article where I show how to use the toolkit to show LOB data in practice.
I’m curious to hear what you think of this approach. Just hit reply and let me know.
PS. Just recently, we also updated documentation of events emitted by Microsoft Graph Toolkit components. You can now more easily see what additional data each event exposes and if it works with a custom template. We hope you’ll find it helpful.